Linking to GEOS 3.11.2, GDAL 3.7.2, PROJ 9.3.0; sf_use_s2() is TRUE
library(raster)
Warning: package 'raster' was built under R version 4.3.3
Loading required package: sp
Warning: package 'sp' was built under R version 4.3.3
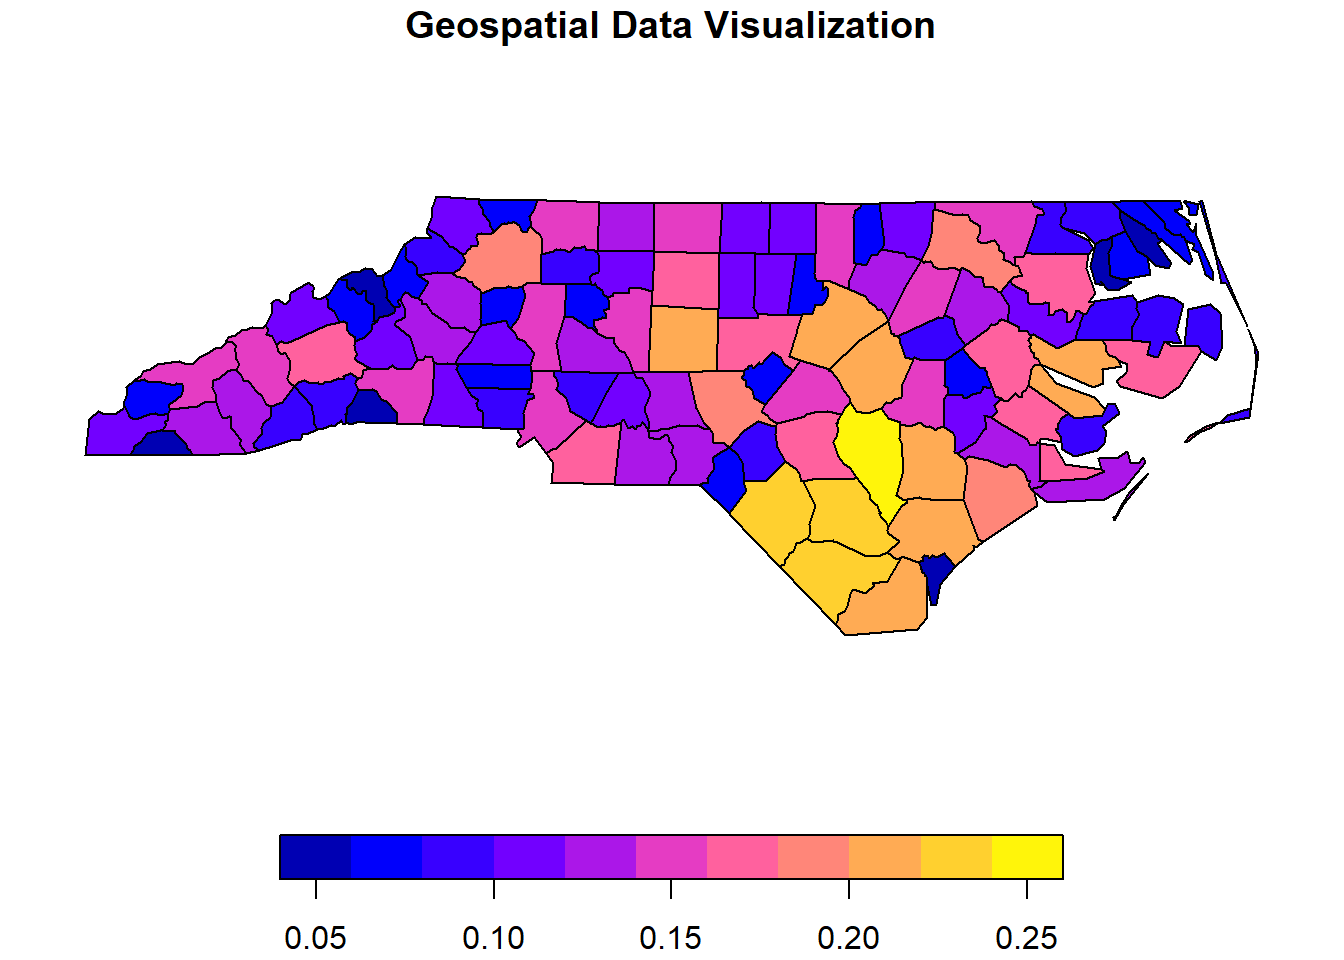
# Load a sample shapefile (replace with your own geospatial data)shapefile_path <-system.file("shape/nc.shp", package ="sf")geo_data <-st_read(shapefile_path)
Reading layer `nc' from data source
  `C:\Users\hafez\AppData\Local\R\win-library\4.3\sf\shape\nc.shp'
  using driver `ESRI Shapefile'
Simple feature collection with 100 features and 14 fields
Geometry type: MULTIPOLYGON
Dimension:     XY
Bounding box:  xmin: -84.32385 ymin: 33.88199 xmax: -75.45698 ymax: 36.58965
Geodetic CRS:  NAD27
# Plot the geospatial dataplot(geo_data["AREA"], main ="Geospatial Data Visualization")
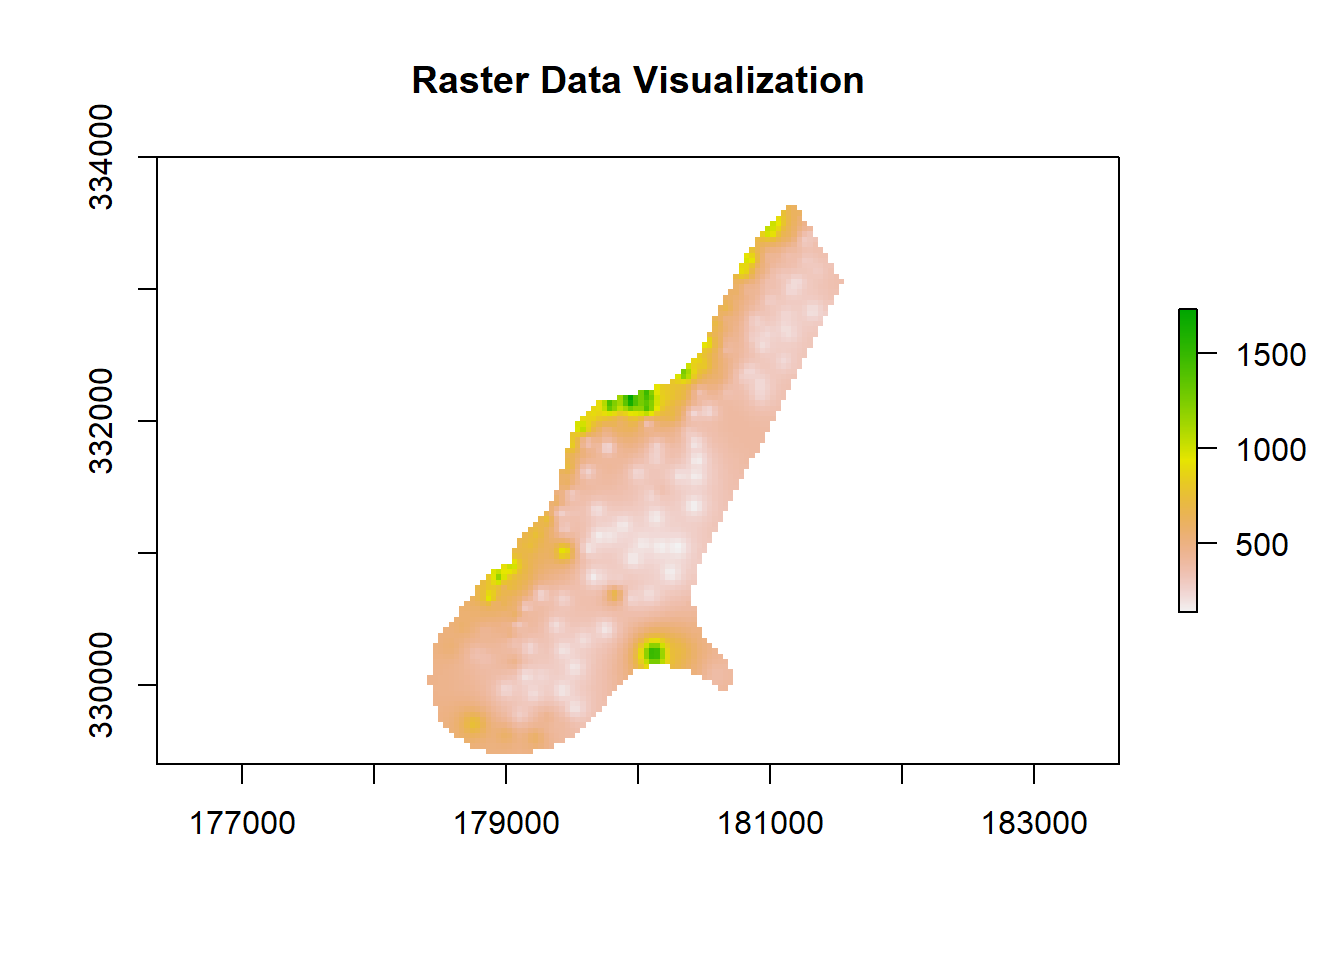
# Load a sample raster dataset (replace with your own raster data)raster_data <-raster(system.file("external/test.grd", package ="raster"))# Plot the raster dataplot(raster_data, main ="Raster Data Visualization")
# Perform a simple spatial operation: calculate the centroid of polygonscentroids <-st_centroid(geo_data)
Warning: st_centroid assumes attributes are constant over geometries
# Add centroids to the plotplot(geo_data["AREA"], main ="Geospatial Data with Centroids")plot(centroids, add =TRUE, col ="red", pch =16)
Warning in plot.sf(centroids, add = TRUE, col = "red", pch = 16): ignoring all
but the first attribute