GIS & Remote Sensing
Geospatial Technology for Coastal Oceanography, Environmental Monitoring & Land Change Science
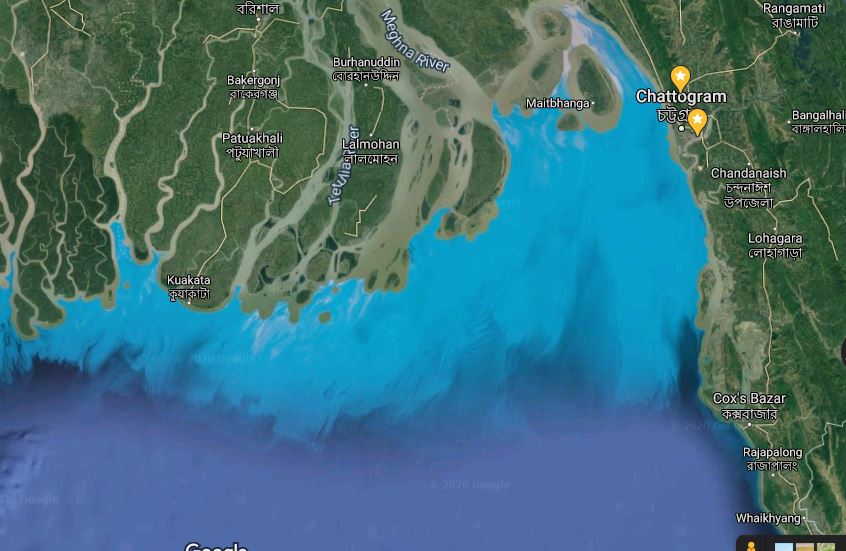
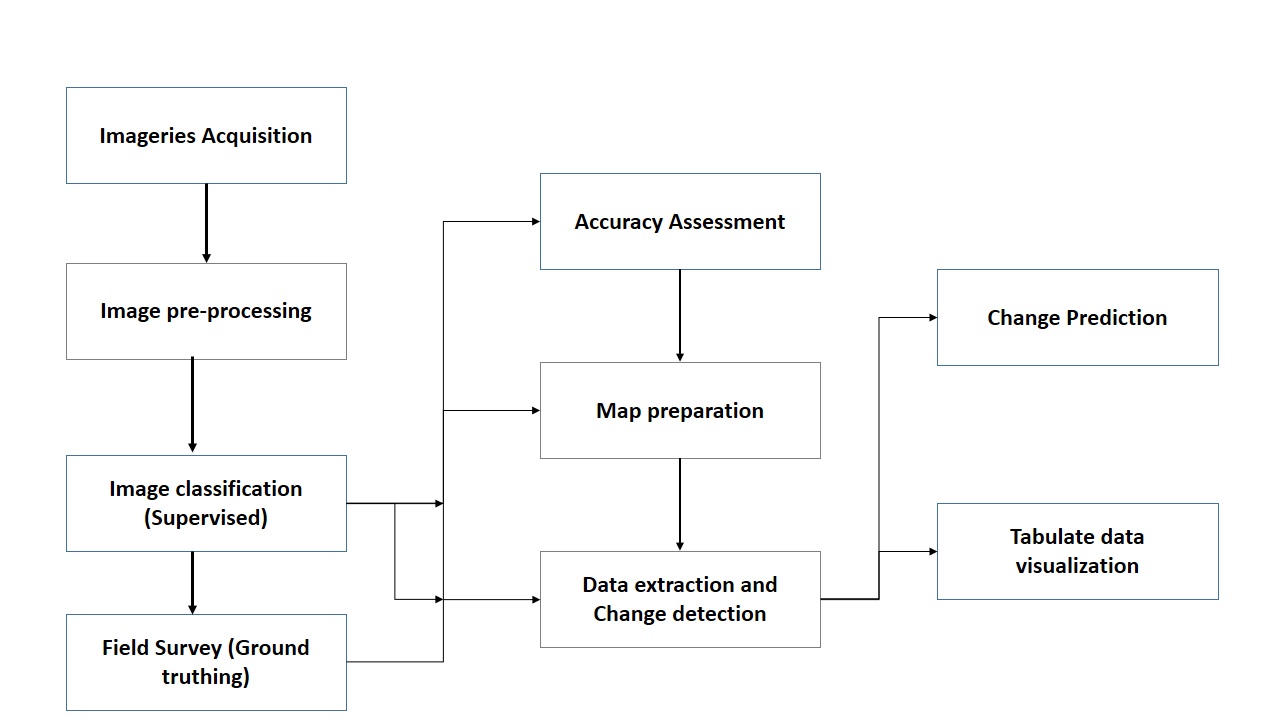
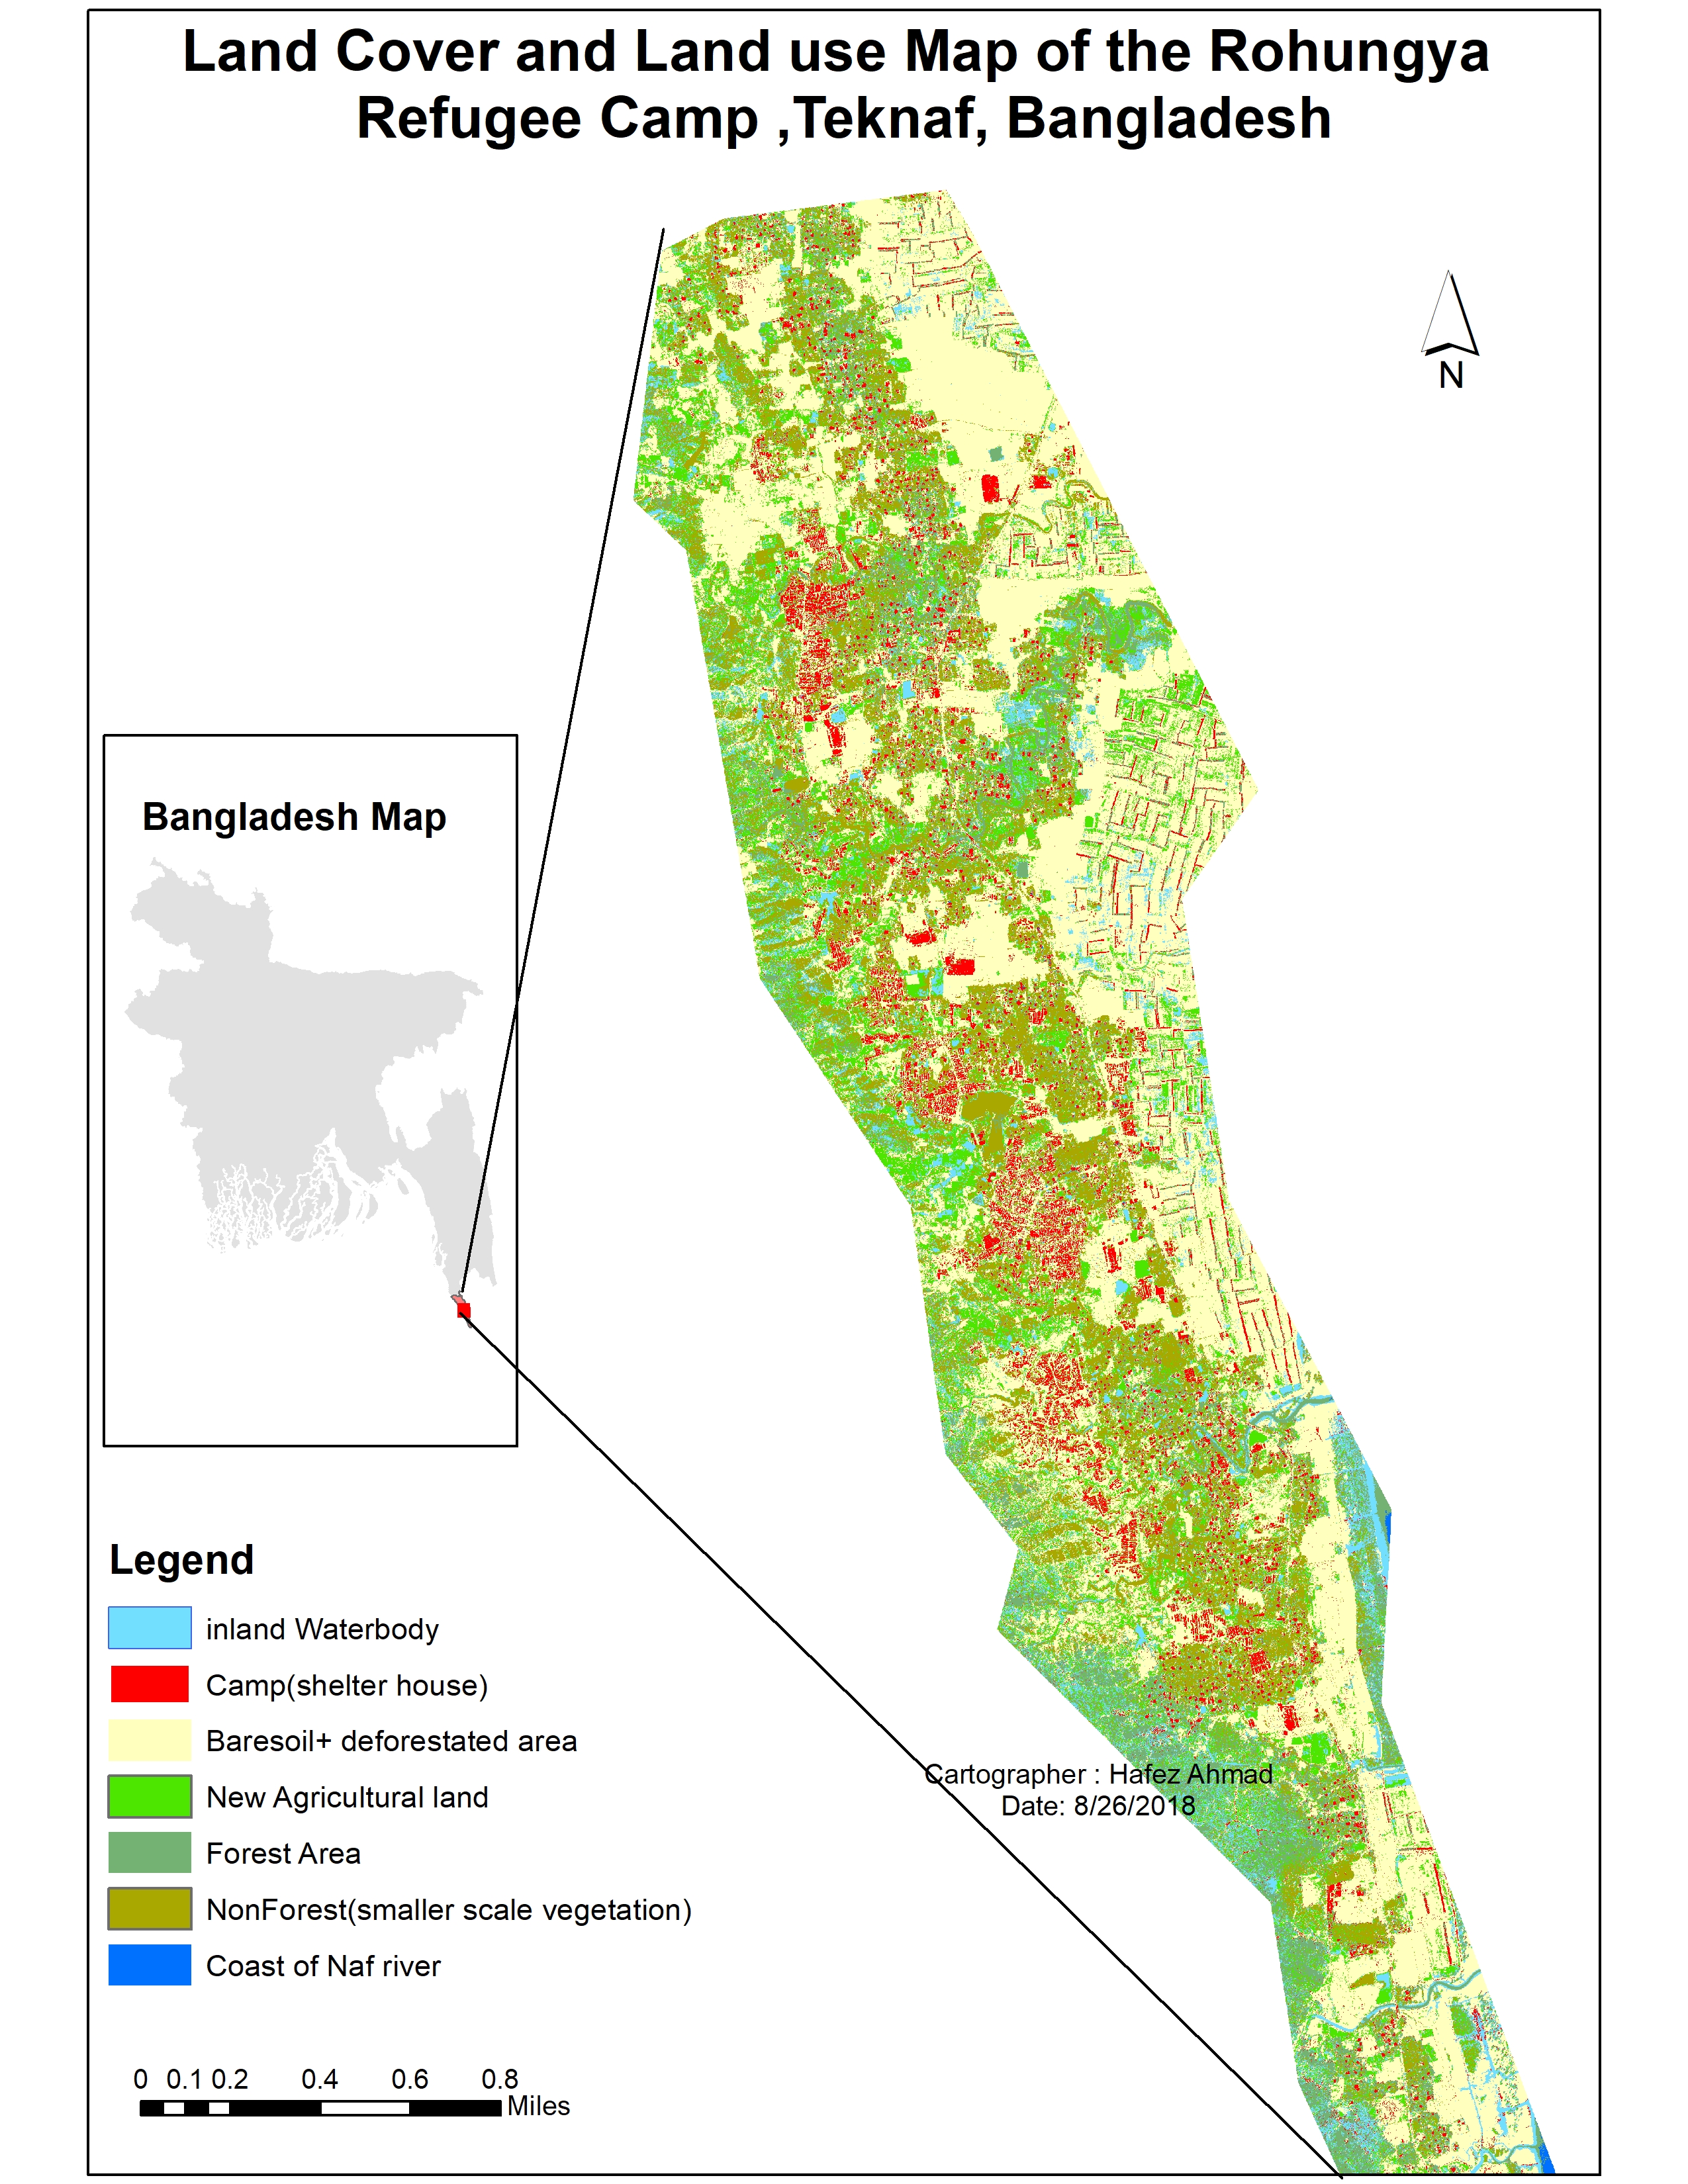
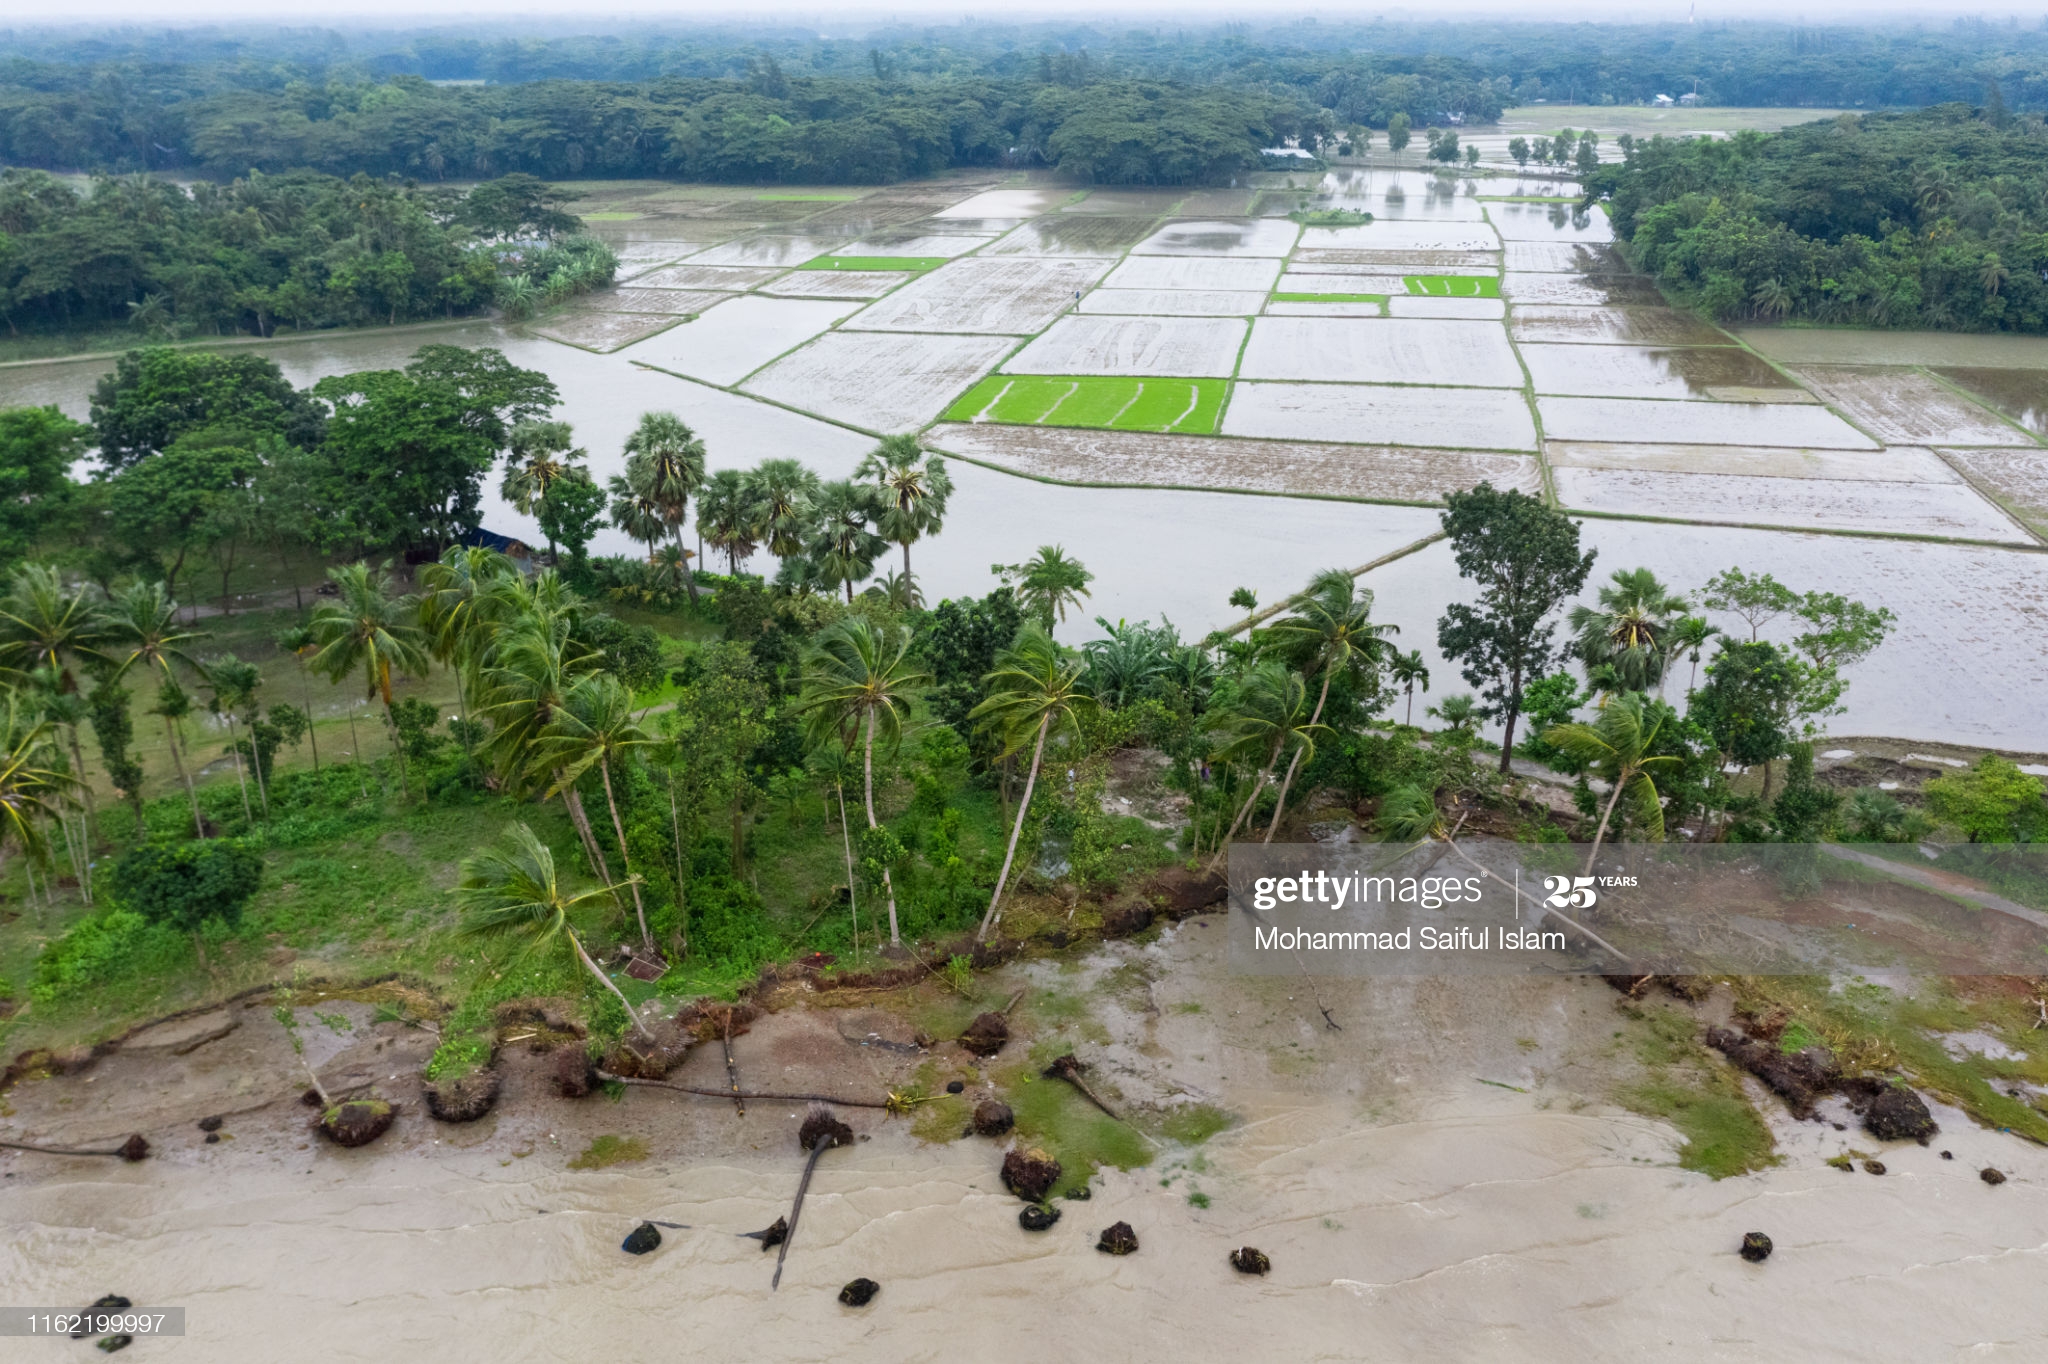
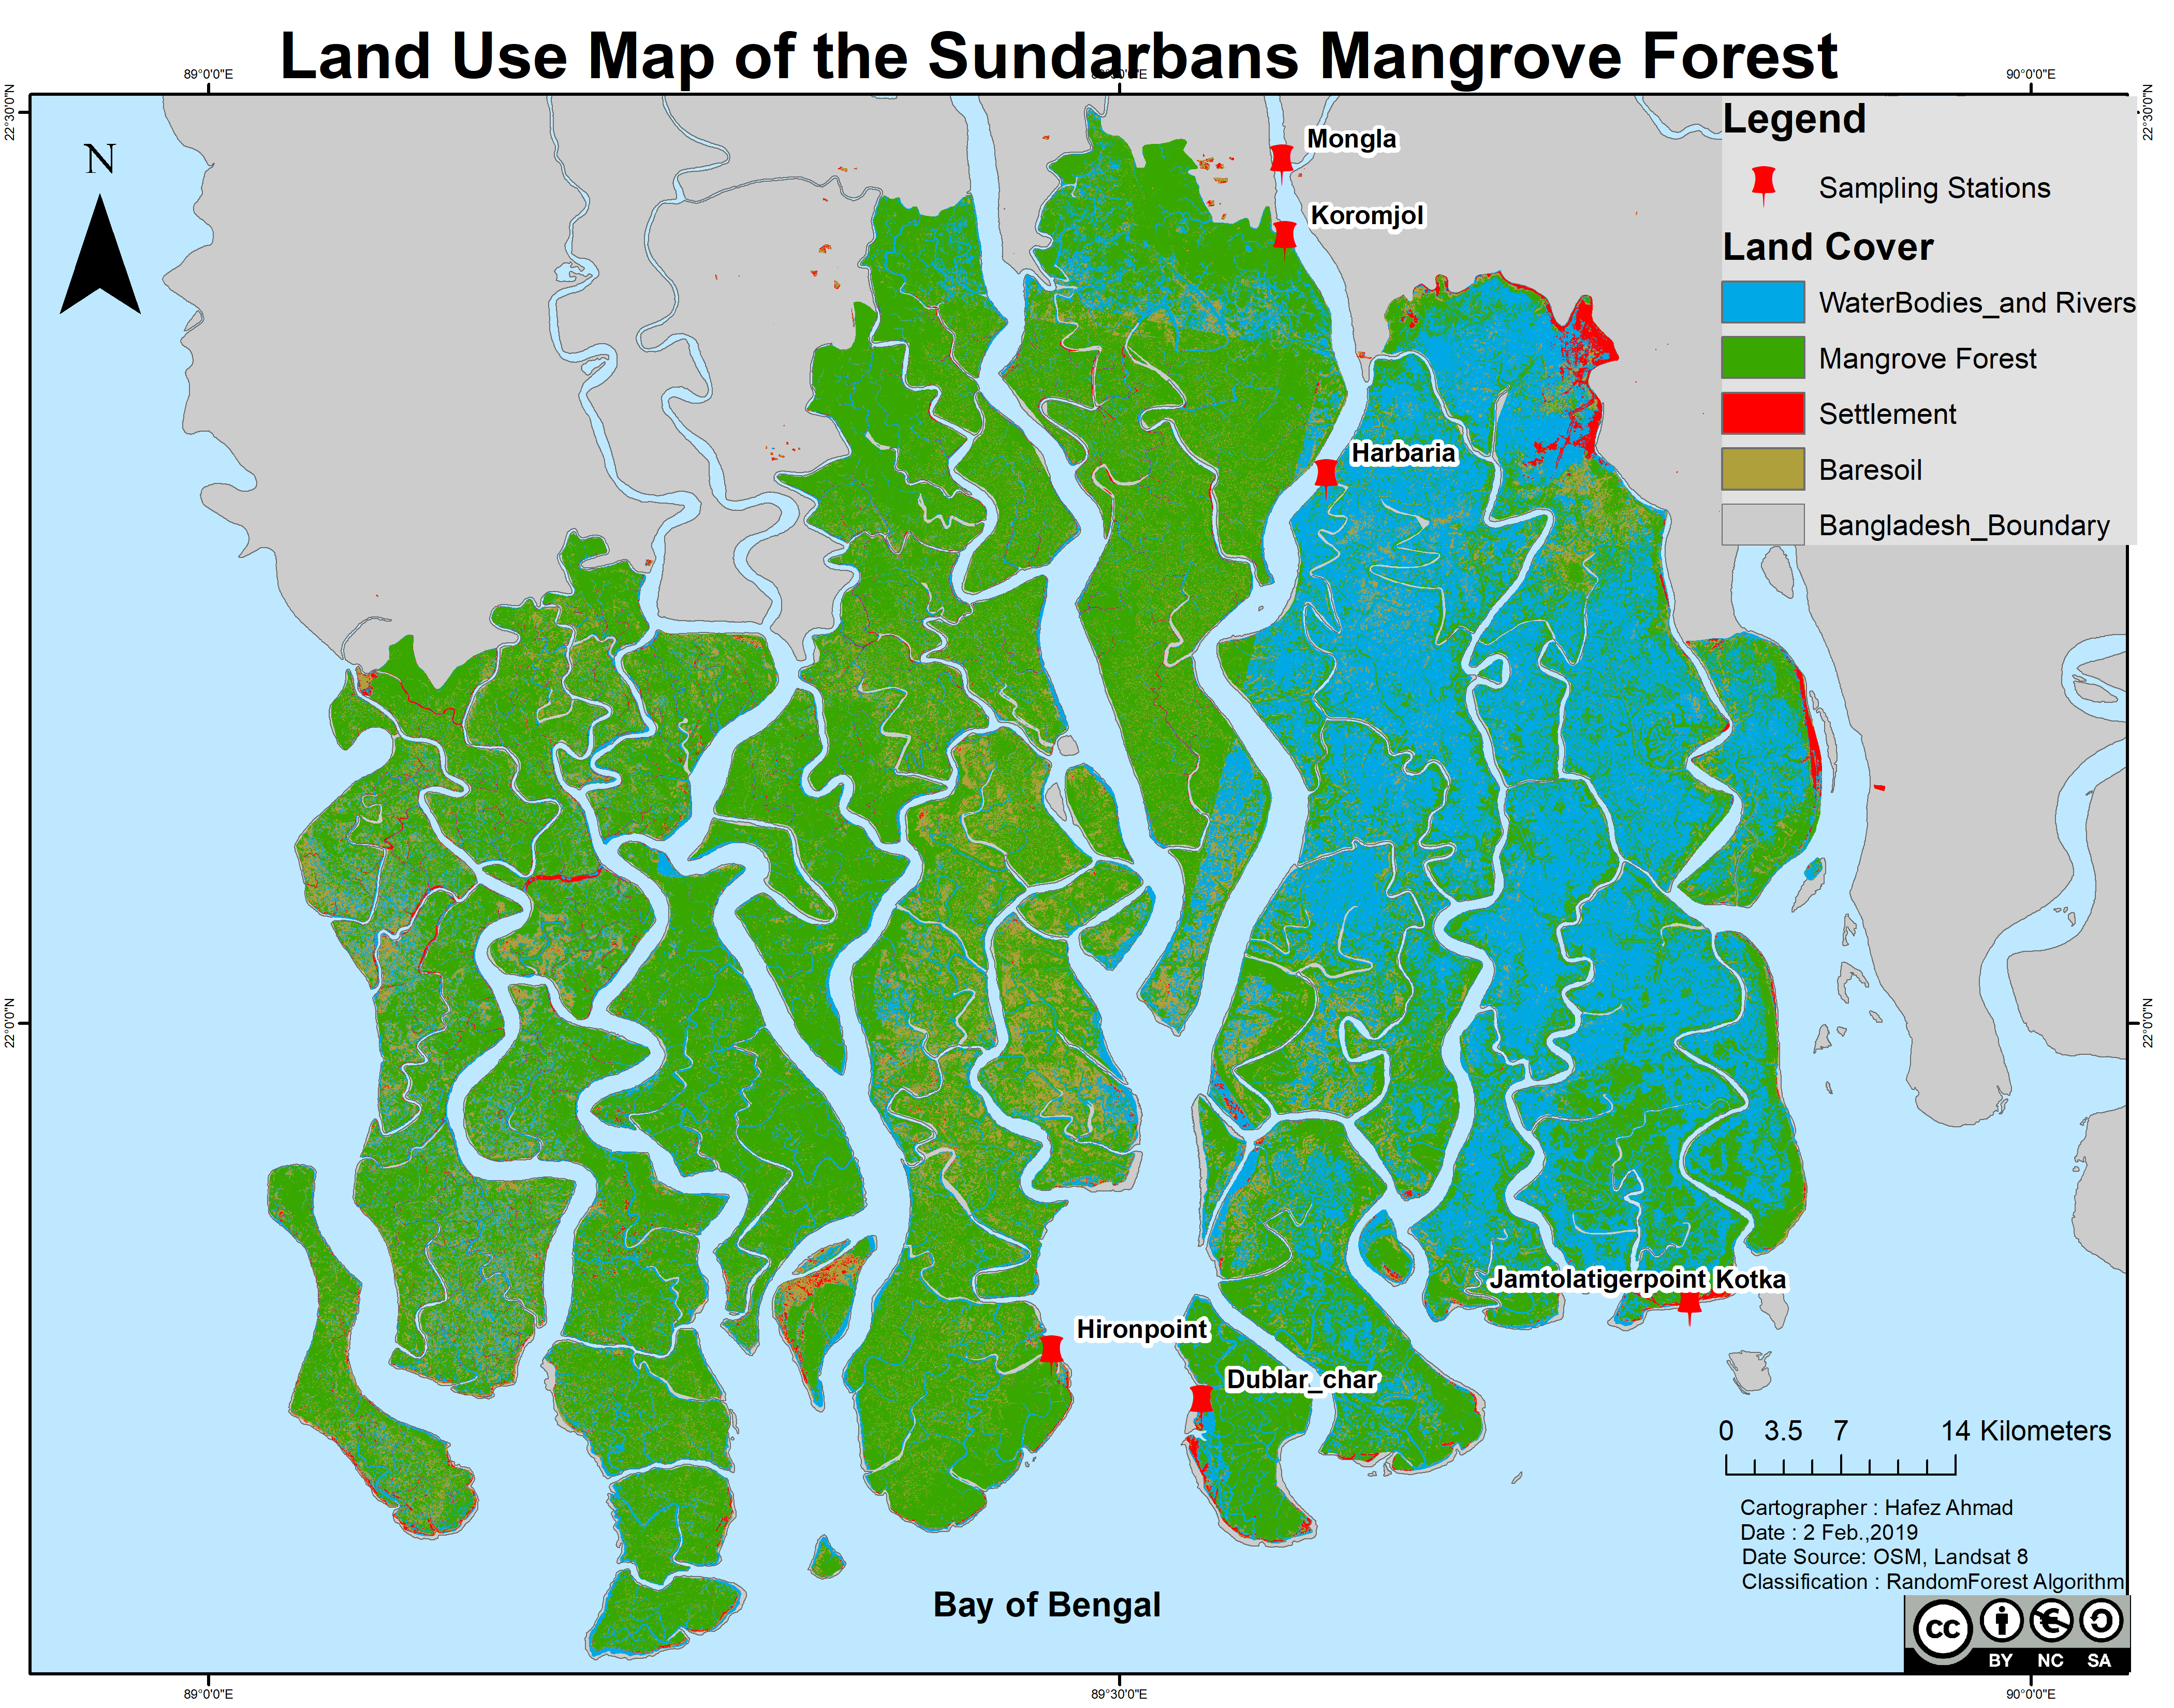
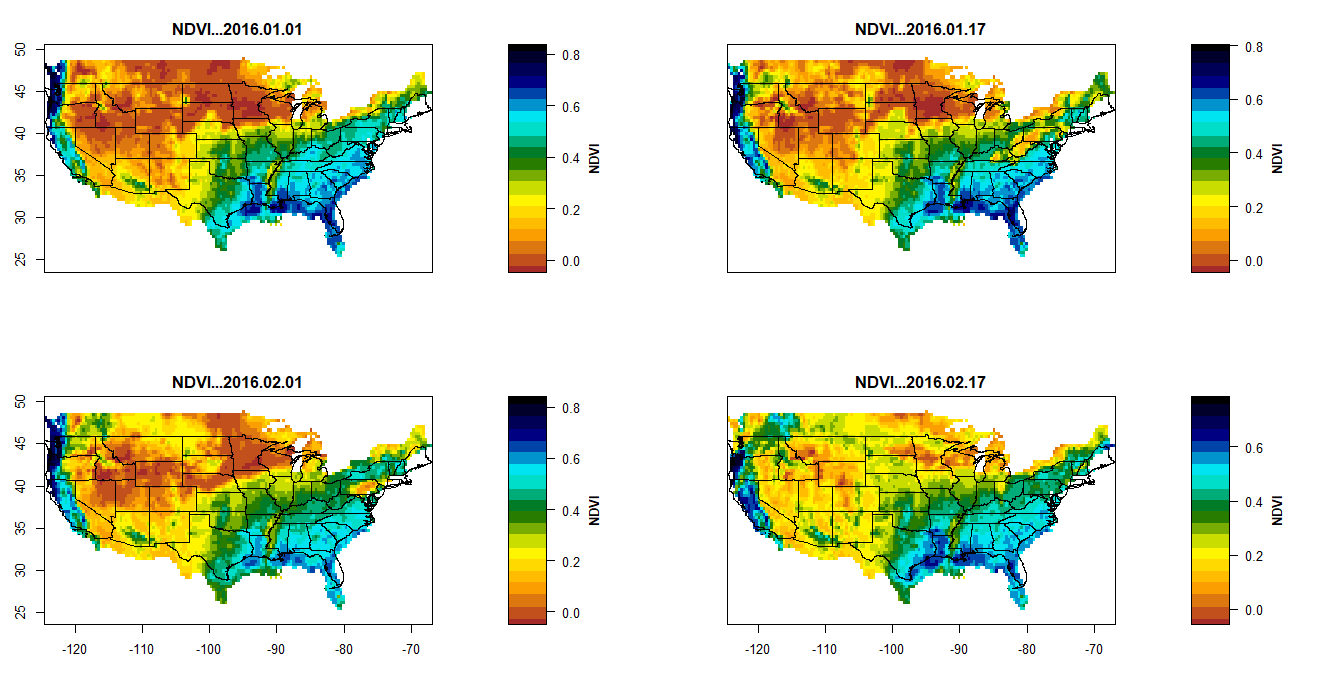
Geographic Information Systems (GIS) and Remote Sensing form the foundation of modern coastal and oceanographic science. I integrate multi-source satellite imagery (Landsat, Sentinel, MODIS, PACE), UAV/drone surveys, and cloud-scale geospatial analysis via Google Earth Engine to study land-use dynamics, coastal vulnerability, water quality, and ecosystem health — from the mangrove coasts of Bangladesh to the Mississippi Sound and Gulf of Mexico.
GIS
Remote Sensing
Google Earth Engine
UAV / Drone
Python Geospatial
Coastal Mapping
Mangrove / LULC
Water Quality RS