Marine Ecology
Biodiversity, Ecosystem Dynamics, Conservation & Ecological Modeling
Marine ecosystems — from sunlit coral reefs and seagrass meadows to dark abyssal plains — cover more than 70% of Earth’s surface and sustain 32 of 33 described animal phyla. My research integrates field surveys, imaging-flow cytometry, molecular tools (eDNA/metabarcoding), remote sensing, and computational modeling to study biodiversity patterns, community dynamics, and ecosystem health across coastal and open-ocean environments in Bangladesh, the US Gulf Coast, and beyond.
Plankton Ecology
eDNA / Metabarcoding
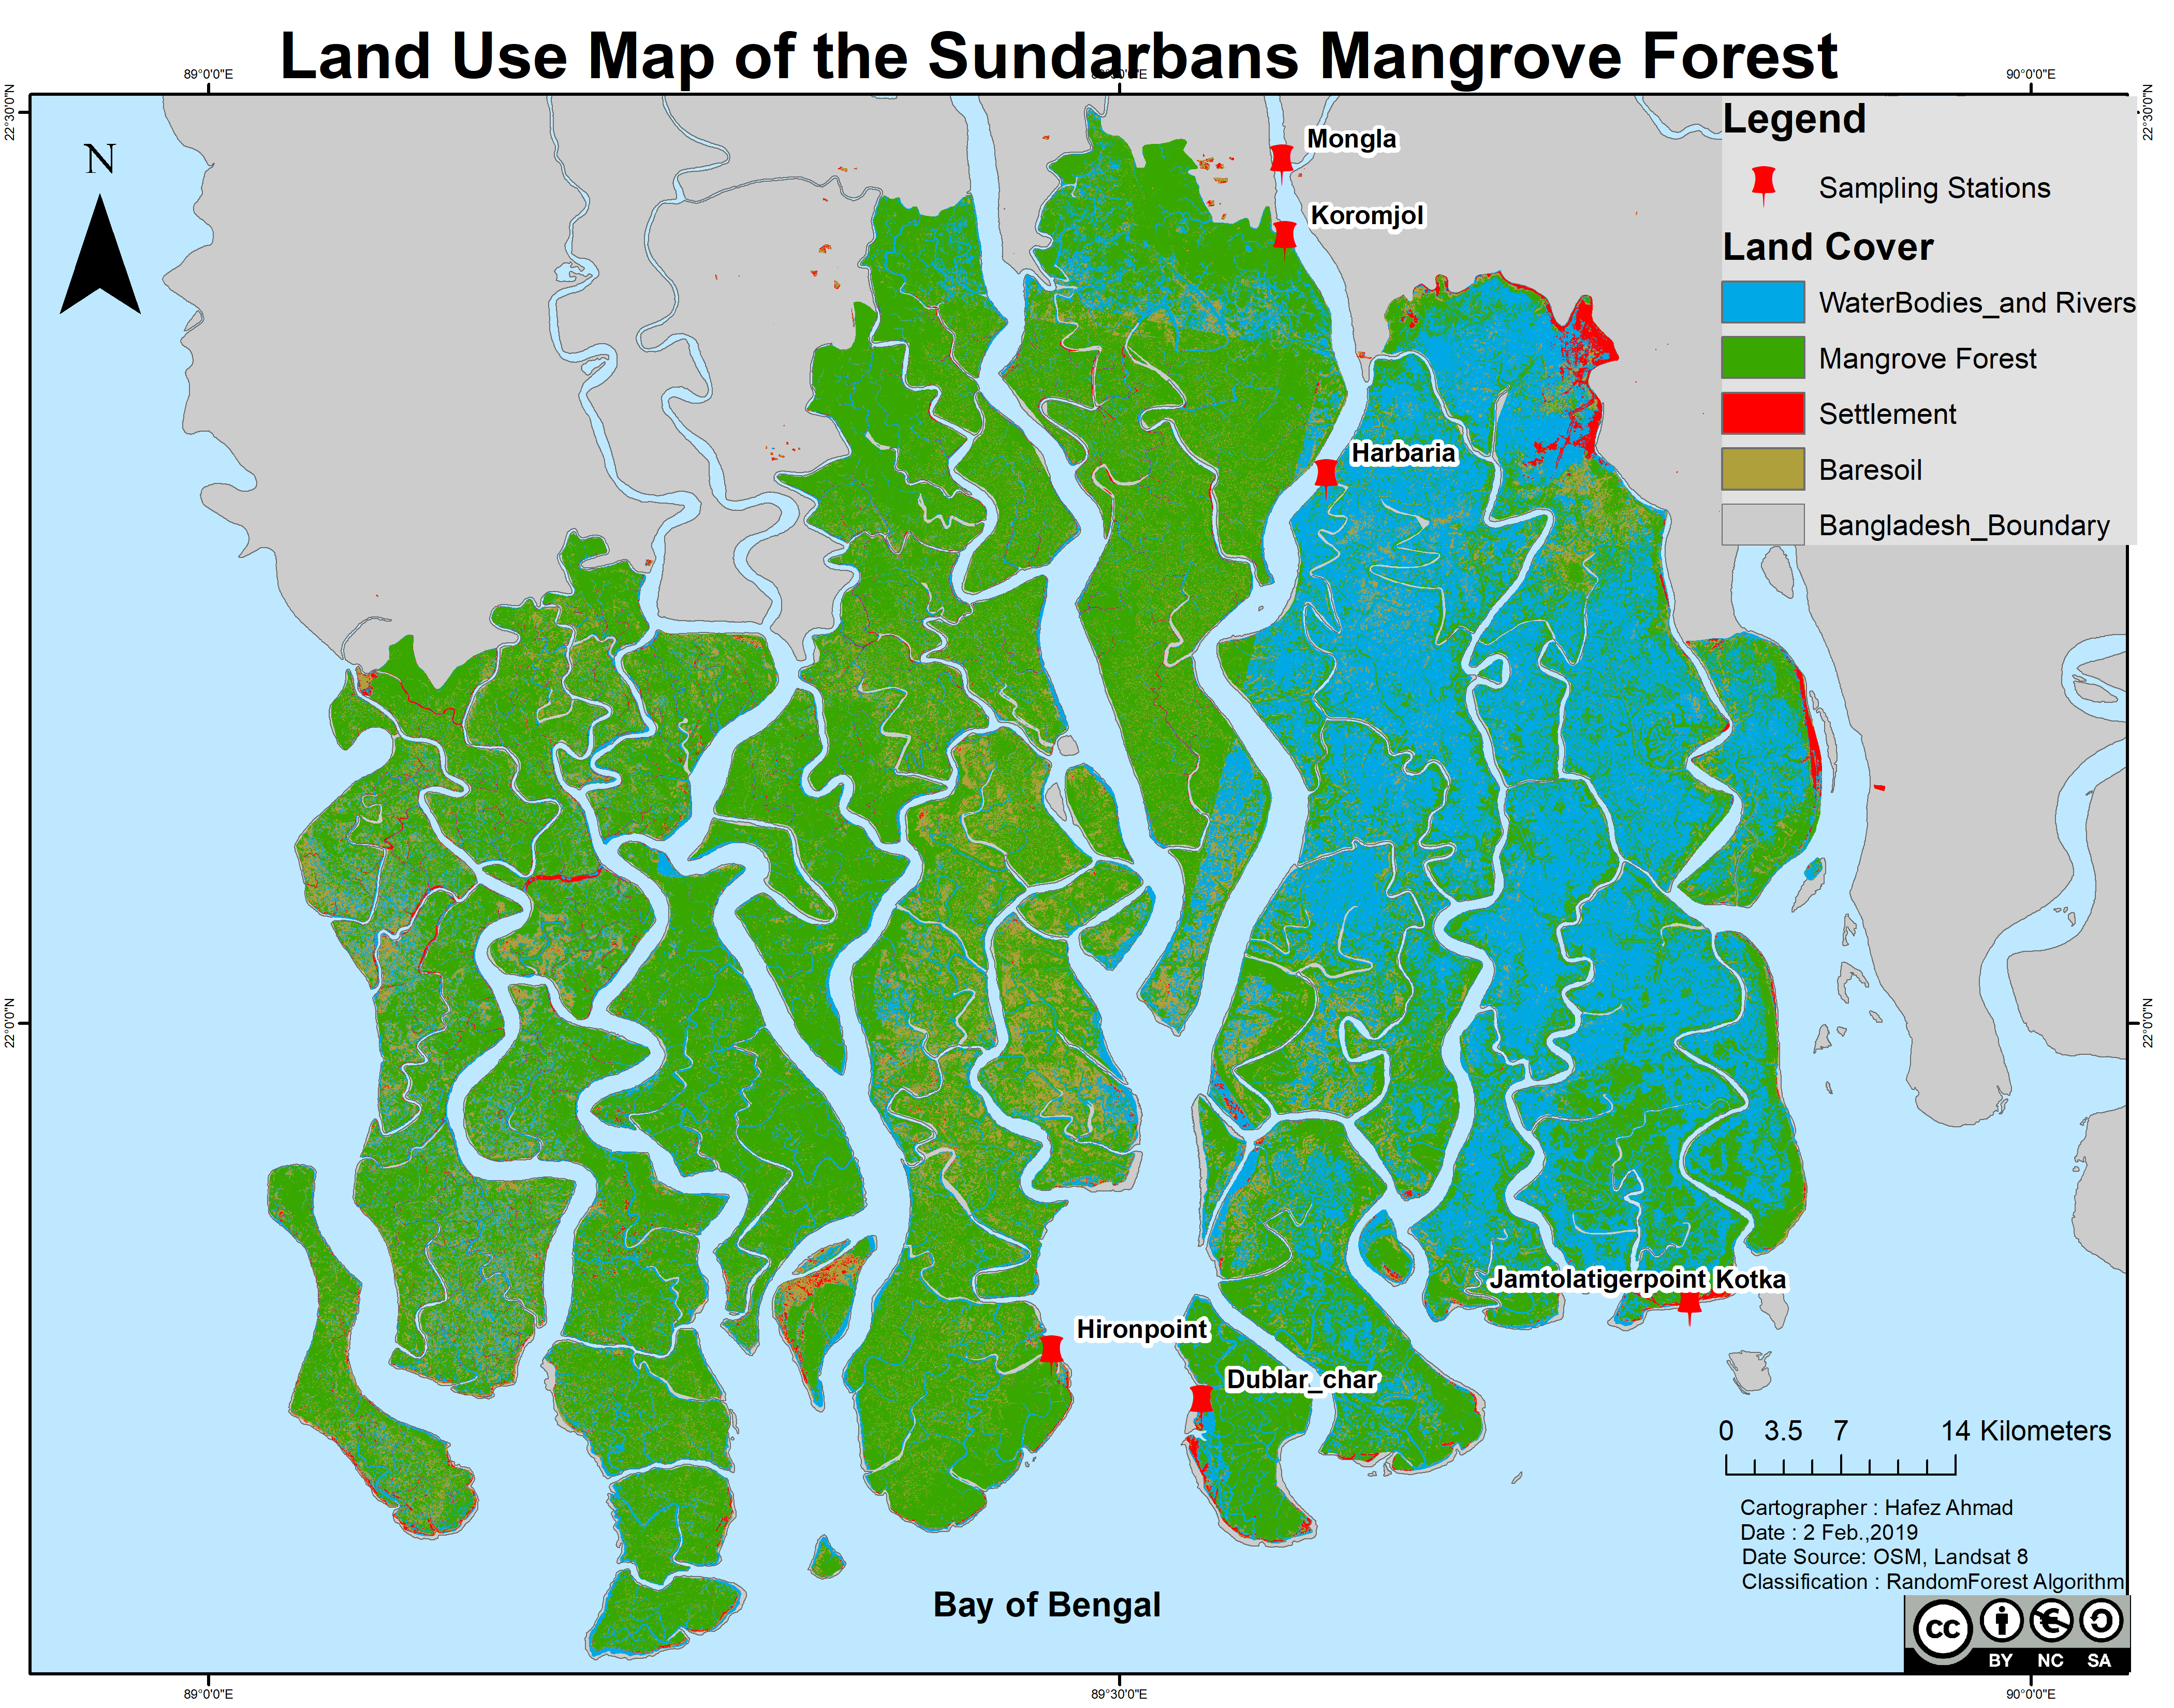
Mangrove & Seagrass
Marine Protected Areas
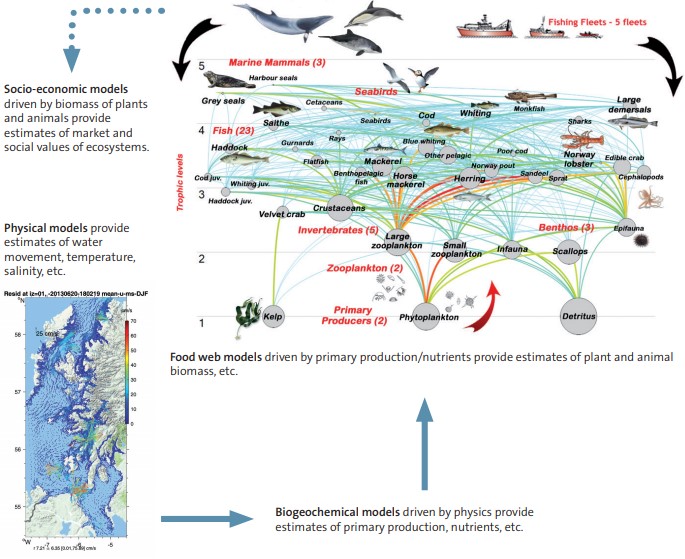
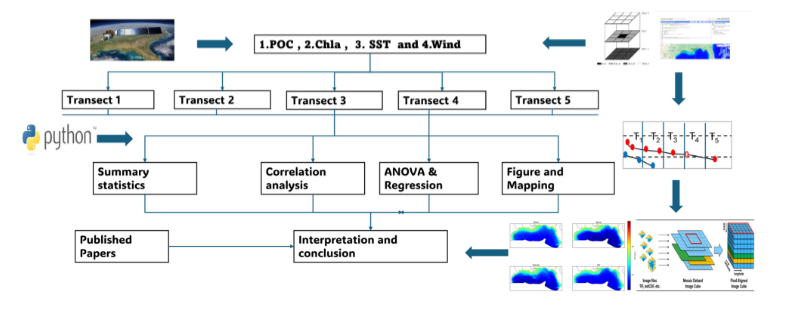
Ecosystem Modeling
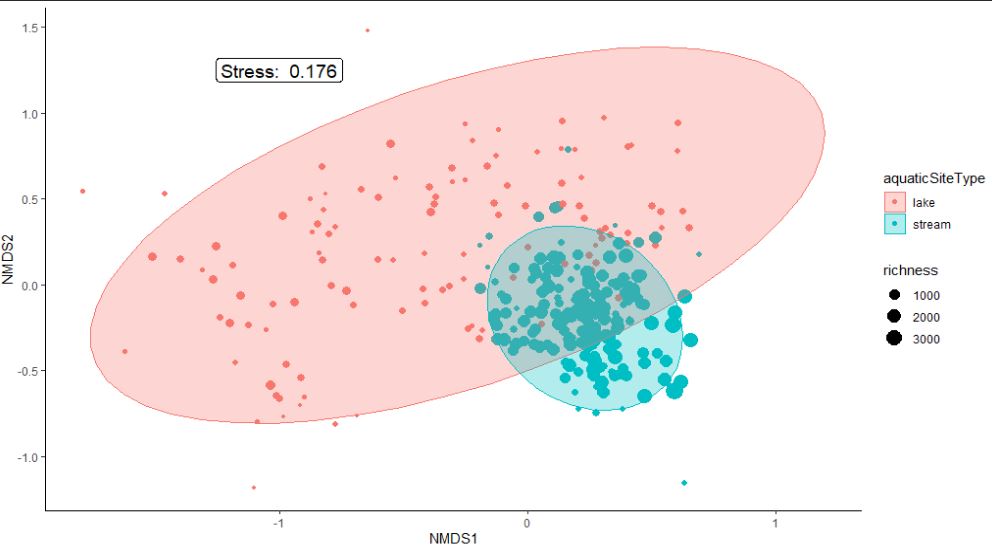
Community Ecology
FlowCytobot / Imaging
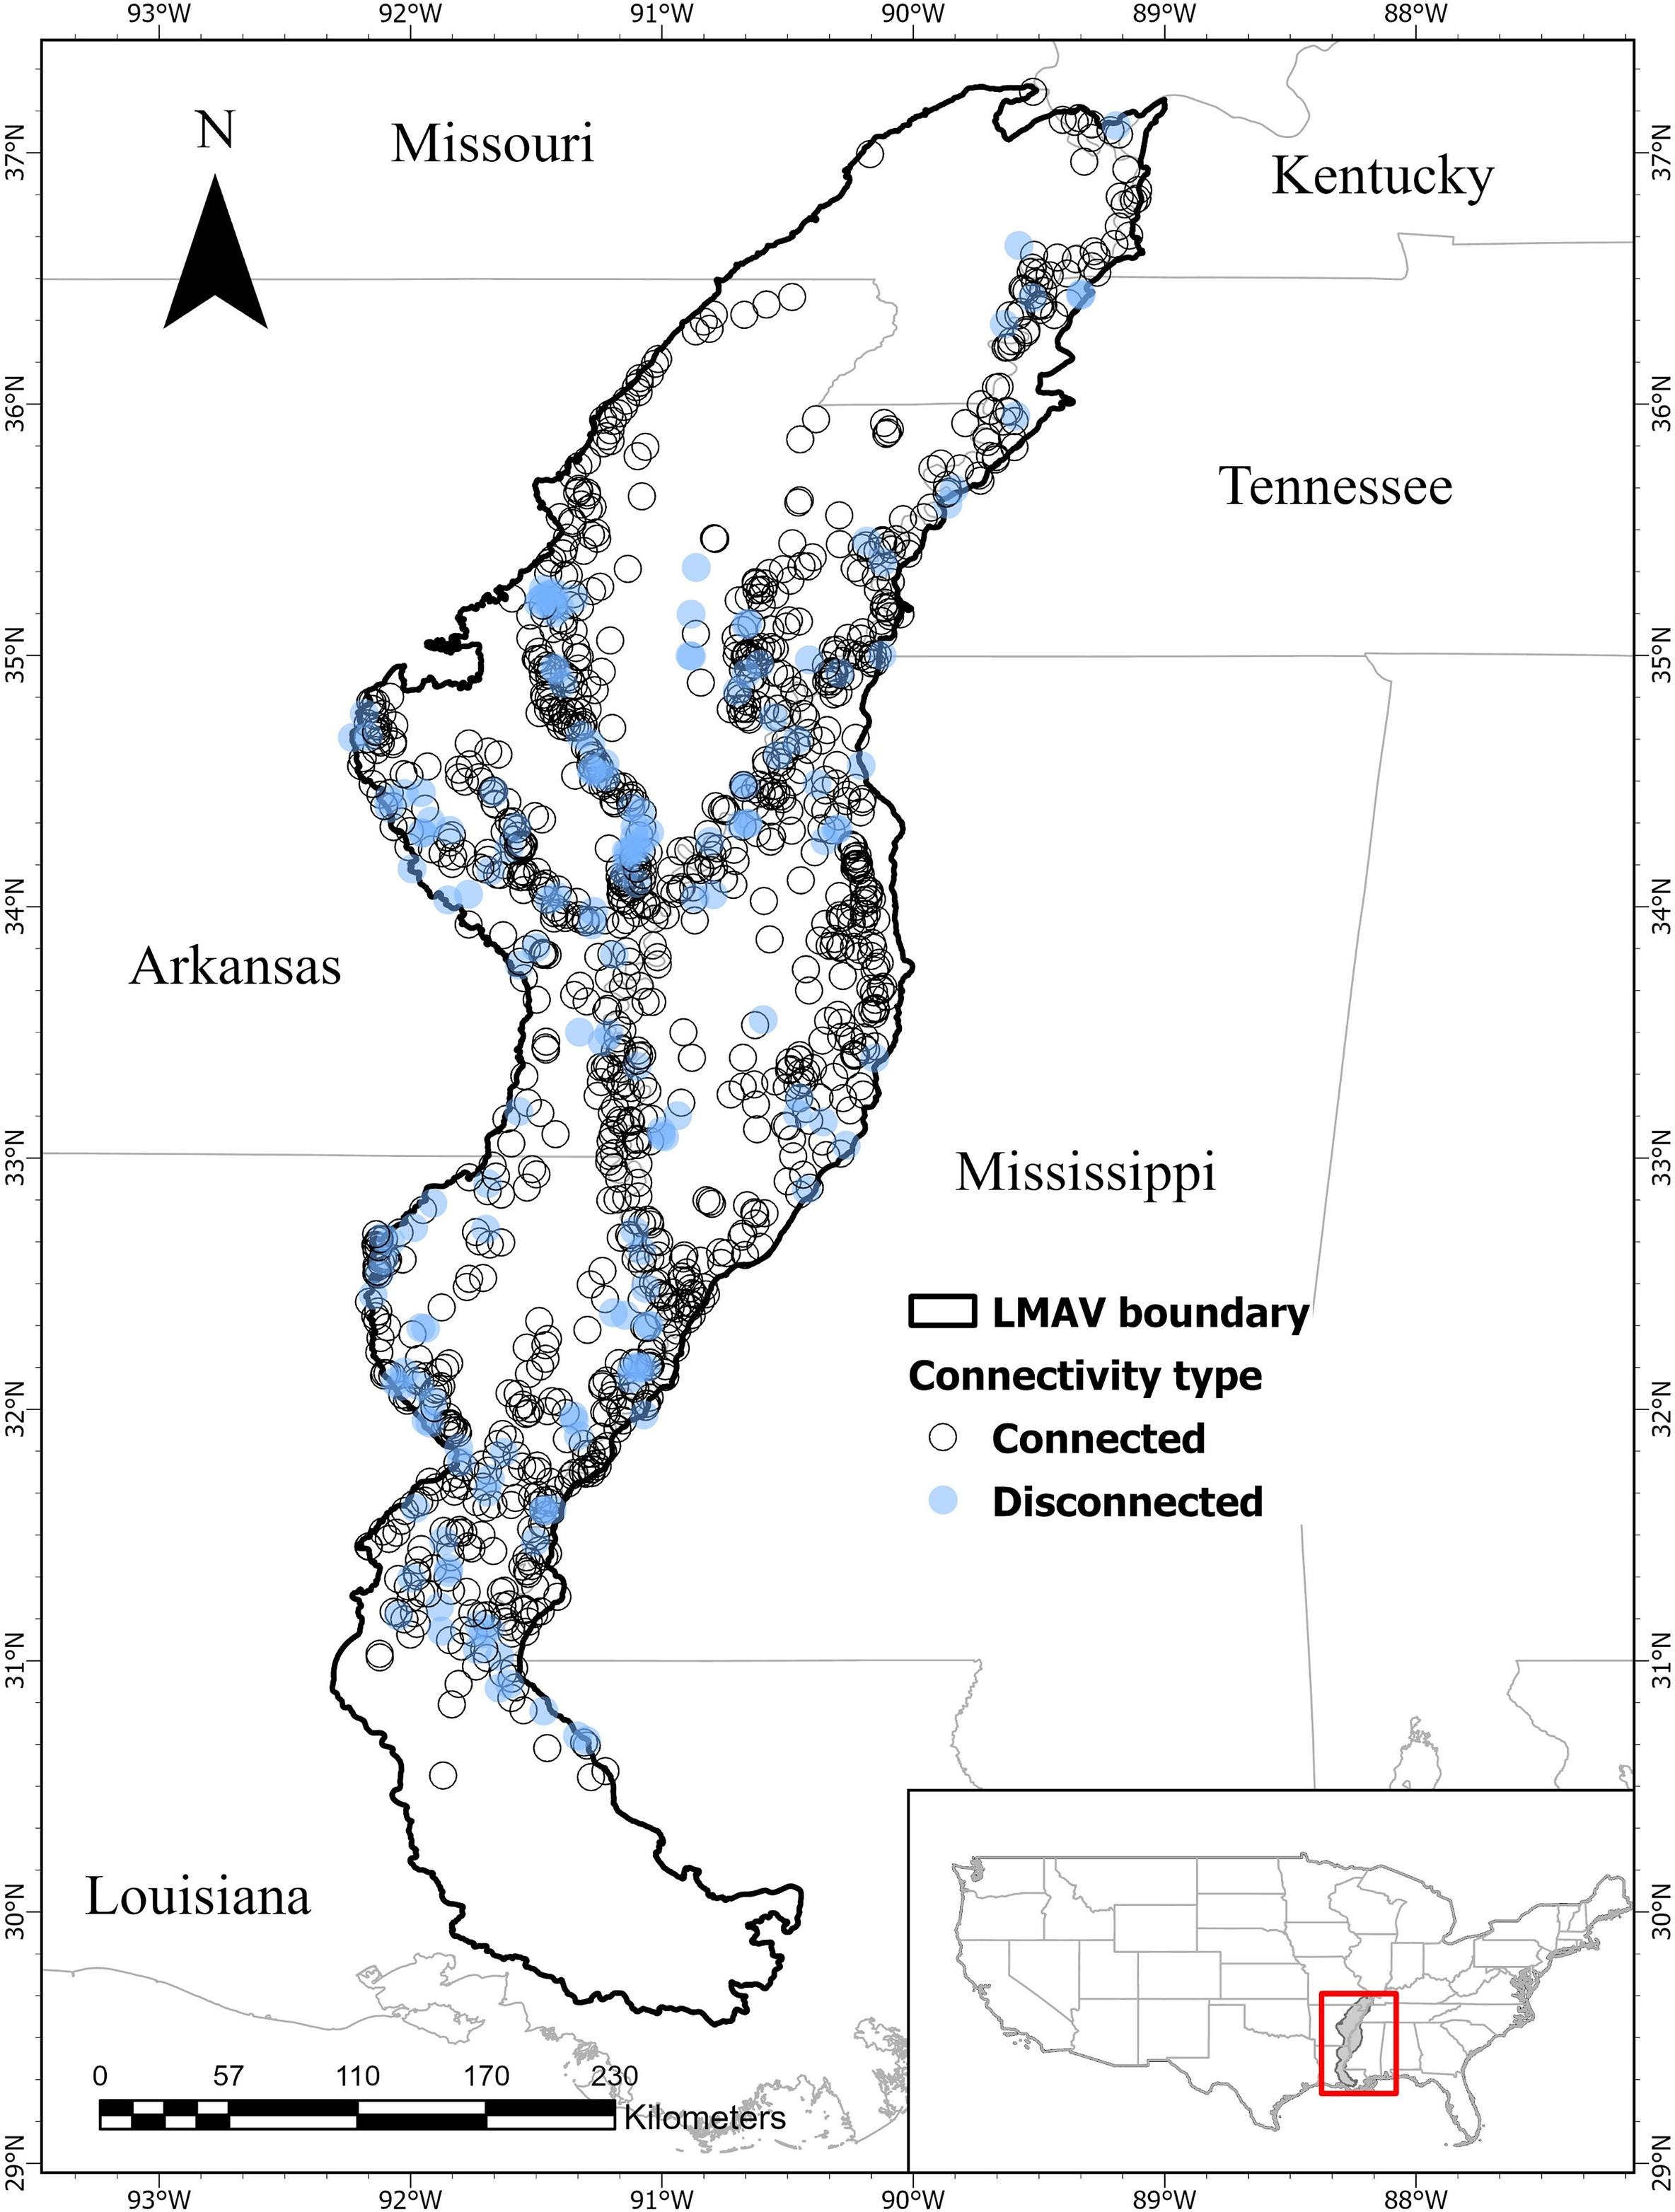
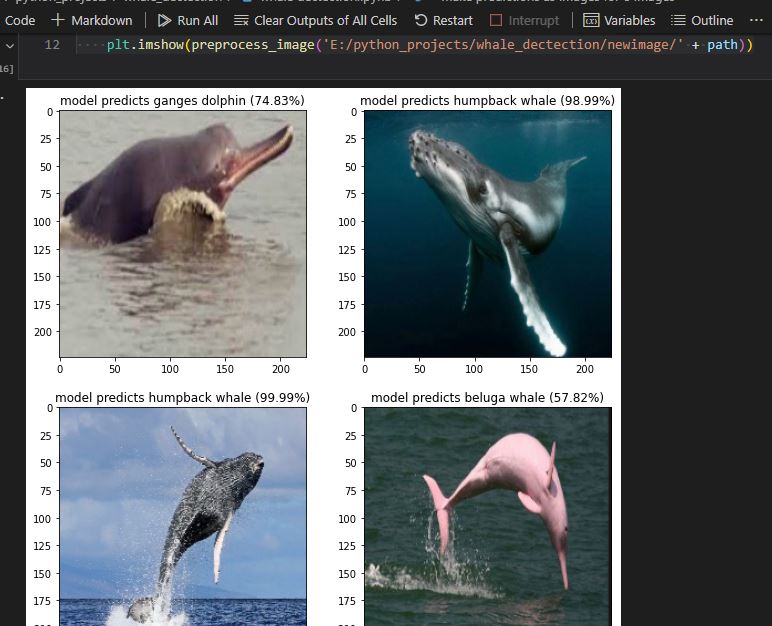
Species Distribution